Continuing my investigation of single-threaded performance in the MariaDB server, I managed to increase throughput of single-threaded read-only sysbench by more than 40% so far:
I use read-only sysbench 0.4.12 run like this:
sysbench --num-threads=1 --test=oltp --oltp-test-mode=simple --oltp-read-only --oltp-skip-trx run
And mysqld is run with minimal options:
sql/mysqld --no-defaults --basedir=X --datadir=Y --innodb-buffer-pool-size=128M
With modern high-performance CPUs, it is necessary to do detailed measurements using the built-in performance counters in order to get any kind of understanding of how an application performs and what the bottlenecks are. Forget about looking at the code and counting instructions or cycles as we did in the old days. It no longer works, not even to within an order of magnitude.
I am using the Linux perf program for this. During my invistigations, I found that the main bottleneck in the benchmark turns out to be instruction cache misses. Here is an example measurement:
| Counter | Value |
|---|---|
| INST_RETIRED.ANY | 170431 |
| ICACHE.MISSES | 17194 |
So 10% of executed instructions missed the level 1 instruction cache (“icache”). That is
bad. The Intel Optimization Manual says this about the ratio
ICACHE.MISSES/INST_RETIRED.ANY:
Anything over 1% of instructions retired can be a significant issue.
So we are 10 times worse than “a significant issue”.
Instruction cache misses cause a bottleneck in the frontend of the CPU – where x86 instructions are fetch, decoded, and supplied to the micro-op queue to be scheduled for the out-of-order dataflow backend. To get an idea about how badly bottlenecked we actually are in the frontend in this benchmark, we can use another measure from the Intel manual: IDQ_UOPS_NOT_DELIVERED.CORE / (4*CPU_CLK_UNHALTED.THREAD) = 81.5%
This ratio estimates the percentage of time in which the front-end is not able to deliver instructions sufficiently fast for the backend to work at full speed. In this case, for more than 80% of the time, the CPU would have been able to do more work in the same time if only instructions could be fetch and decoded faster.
Note the importance of this analysis in knowing what areas to work on to improve performance. Roughly speaking, 80% of our time is spent waiting for the icache. We could have spent years on improving data locality or branch mispredictions or whatever in the code, and we would never have been able to get very big improvements. Now, knowing where the sore spot is, we can spend our efforts where it matters the most.
In the case of icache misses, the best place to start is with profile-guided optimisation. This works by first running a specially instrumented mysqld binary to collect data about the load during the benchmark. Then the binary is recompiled, where the compiler can take into account the information obtained to better optimise the generated code.
Using information about how the program actually behaves when run can help the compiler lay out the basic blocks of the program to benefit the most common execution paths. This can help reduce the footprint in the icache by reducing jumps into or out of the middle of a 16-byte instruction stream (such jumps waste the rest of the 16-byte stream, which is the unit of storage of the icache). It can also increase the length of straight-line code execution paths, which should help the hardware prefetcher keep the level 1 icache supplied.
So that is the theory – but does it work in practice? It turns out that it does. First I compile with --coverage added to the CFLAGS/CXXFLAGS. Then I run sysbench to generate the profile data. Then I recompile adding instead the --profile-use flag. That is all there is to it, GCC handles everything else automatically.
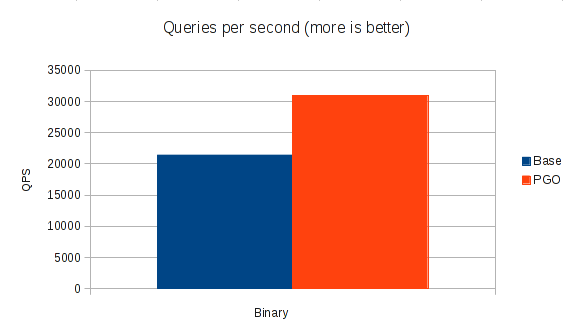
Re-running the benchmark with the optimised binary yields a large speedup:
| Binary | Queries per second | Speedup |
|---|---|---|
Base: -O3 | 21404 | |
PGO: -O3 --profile-use | 30903 | 44% |
So a 44% speedup just from compiling with different optimisation, not bad! (The actual server-side improvement is in fact even higher, as the sysbench client consumes part of the runtime due to the single-threaded nature of the test).
By the way, that 44% speedup comes from just a modest reduction in icache miss rate – from 10% down to 8%. It just shows how expensive those icache misses are. Fetching from L2 cache takes something like 12 cycles, and during each of those cycles the CPU will be able to do nothing. Given that we could potentially execute 4 operations in the backend each of those clocks, that is a lot of waste. So with 8% misses still left there is room for further huge improvements, though those improvements will likely be much harder to achieve than just fiddling with compiler options.
I think it is clear that we will need to start using profile-guided optimisation for future MariaDB binaries. This will be some work, as we need to develop a set of typical workloads to optimise after, and integrate running of those into the compilation. We will need to cover a range of different common usages to optimise after. And more tests with a wider range of benchmarks will be needed to ensure that the gain is more generally applicable and does not cause significant regressions in performance of other parts of the code. With such a huge improvement in this test I am confident that things can be generally improved, but it still needs proper testing.
My work on improving single-threaded performance will continue, as time permits, and I certainly expect more good results along the way (several patches are already in the pipeline). But I thought this one was so interesting that it was worth mentioning to a wider audience.
Any idea on the source of the icache misses? InnoDB? Optimizer? Parser + semantic analysis?
Mark
The icache misses come from all over the code. Presumably the problem is simply that as part of processing one query, we are running more code than can fit in the icache (32kB). So cached code is constantly being evicted by newly executed code.
How does it look under -Os?
I tested -Os, but it was a bit slower than plain -O3
If I read you correctly, you are using the same benchmark for optimizing as well as measuring performance increases. You need to have different test and training sets or your measurements don’t generalize.
See Wikipedia’s article on cross validation (https://en.wikipedia.org/wiki/Cross-validation_%28statistics%29).
Agree. Basically, what we need is a set of different tests/loads that cover typical usages, and then test the results against a wider set of benchmarks.
How about offering such a tuned binary to one of your commercial customers to test on their real-world workload (or if they want to compile their own, and their system is compatible, share your profiling output)? You’re not going to find a lot of banks willing to test that for you, of course, but in the web/ecommerce realm, there ought to be a relationship you should be able to use to get REAL data on this?
Hi!
It would be interesting to see the hottest spots…. Having to execute just a lot of code is not an explanation. If it would be so, then profiler feedback won’t affect performance so much. I believe the reson for so big difference for the results is branch misprediction.
When I read the results I though about too large code – MySQL does a lot of things which have code which in turn must fit instruction caches. The next thing is jumps, function calls. However, the -O3 is very aggressive on function inlines and this thing shouldn’t depend on profile feedback. There is probably some other places which can lead to the results, but I reckon the problem is in trivial branches – if statements. This is common practice in Linux kernel to use likely/unlikely compiler tips (__buitin_expect() backended), but they are not so widespreaded in MySQL code. It seems that some crucial for the workload branches are mispredicted.
I ended up writing a longer answer to this as a follow-up post:
https://knielsen-hq.org/w/more-on-40-better-single-threaded-performance-in-mariadb/
And the end, you will find detailed profiles showing the hottest parts with respect to instructions executed, icache misses, and branch mispredictions.
Great article Kristian. This is pretty cool.
I’m assuming the cpu utilization was close to 100% when you ran this test in order to get a 40% speedup from compiler optimizations. Any idea what the CPU utilization of a typical real word mysql workload would be? That % would cap you’re speedup.
Correct me if I’m wrong but I was under the impression that the vast majority of real word mysql setups are I/O bound.
D
I do not really have knowledge about which percentage of real world workloads is IO-bound and which is CPU-bound. You are certainly right that it is easy to focus too much on CPU-bound loads; this is seen all too often with benchmarks, most of them tend to be read-only and on small data sets that fit in memory, and so test only CPU, which as you say is not necessarily realistic. Still, there are _some_ busy and heavily optimised sites that are limited by CPU, especially in replication due to its single-threaded nature.
Thanks for your previous reply! Another question..
You went from 10% i-cache misses to 8%. How can this 20% reduction in i-cache misses result in a 44% speedup? I’m just thinking about Amdahl’s law here. If we spent 99% of the time in i-cache misses, a 10% reduction at best will buy you ~10% reduction in compute time (slightly different than speedup). Of course not every i-cache miss will be the same, but I’d say that’s a reasonable estimate all other things being equal.
When you compile with profile feedback, it enables instruction layout & branch reduction optimizations based on profiling info which will reduce i-cache misses, but there are many other powerful optimizations enabled which don’t target i-cache misses. Without isolating which profile directed optimizations you’re enabling, there’s no way of knowing how much each is giving you. In general I’d say opts are making a big impact here.
> You went from 10% i-cache misses to 8%. How can this 20% reduction in
> i-cache misses result in a 44% speedup? I’m just thinking about Amdahl’s law
> here. If we spent 99% of the time in i-cache misses, a 10% reduction at best
> will buy you ~10% reduction in compute time (slightly different than
> speedup). Of course not every i-cache miss will be the same, but I’d say
> that’s a reasonable estimate all other things being equal.
Actually, I do not thing it is a reasonable estimate to assume that every i-cache miss costs the same. The cost of an instruction missing the icache can be from a few cycles to several hundred cycles, and there can be strong correlation between the cost to different instructions (the cost is likely to be far higher for the first instruction in a straight-line code sequence than for any following instructions).
I would think it perfectly possible that a 20% reduction in icache misses could give more than 20% speedup. Or conversely, it could give almost no speedup, depending on circumstances.
But in any case, you are absolutely right that the speedup is due to a number of different things, not just icache miss reduction. For example, I remember that some memcpy/memset operations were optimised to use a faster method, presumably due to knowledge about how large the operations were during profiling, and this had a visible impact on performance. As you say, there are so many different optimisations done that it is not possible to conclusively say how much impact each individual optimisation has.
My point here is mainly that 1) profiling shows that icache miss rate is the main bottleneck experienced by the CPU during execution, and 2) profile-guided optimisations manage to significantly reduce (but by no means eliminate) the icache miss rate. This to me says that icache miss rate reduction is likely the major cause of the speedup, but certainly not the only one.
Can this be used for official binaries?
Any idea as to how the PGO optimized binary performs when the workload changes from what it was originally compiled for?
Do you know if there are any plans for the official distribution of the MariaDB binaries to be built using PGO?
Re: Can this be used for official binaries?
> Any idea as to how the PGO optimized binary performs when the workload
> changes from what it was originally compiled for?
Yes, this is the critical question, I think. I did some various testing of this, but got inconclusive results. In some cases, a different workload was still a bit improved, or the same. But in other cases, a different workload was significantly slower than non-PGO-optimised binaries.
> Do you know if there are any plans for the official distribution of the
> MariaDB binaries to be built using PGO?
I had such plans:
https://mariadb.atlassian.net/browse/MDEV-6675
I even had a more-or-less complete patch for this, if I remember correctly. I will try to dig it up and link it here and in the MDEV-6675.
But after making the new Debian packages I did a quick test of them and found them to be _slower_ than the non-PGO binaries. So I put the project on hold. It seems that a deeper understanding is needed of how PGO affects single-threaded performance in general…
Re: Can this be used for official binaries?
Here is the patch: http://knielsen-hq.org/mariadb-deb-pgo.patch
(I also attached it to the issue tracker).
The patch should be complete. It includes the small test program that ran slower, not faster, on the PGO binaries.
Probably the slowdown needs to be investigated and understood before going further with this…